


Amazon’s US independent sellers averaged more than $375,000 in sales in 2025. But sales are not take-home income. These Amazon seller statistics cover marketplace size, business models, fulfillment, advertising and profitability, with the year and population attached to each figure.
8 Key Amazon Seller Stats (Editor’s Pick)
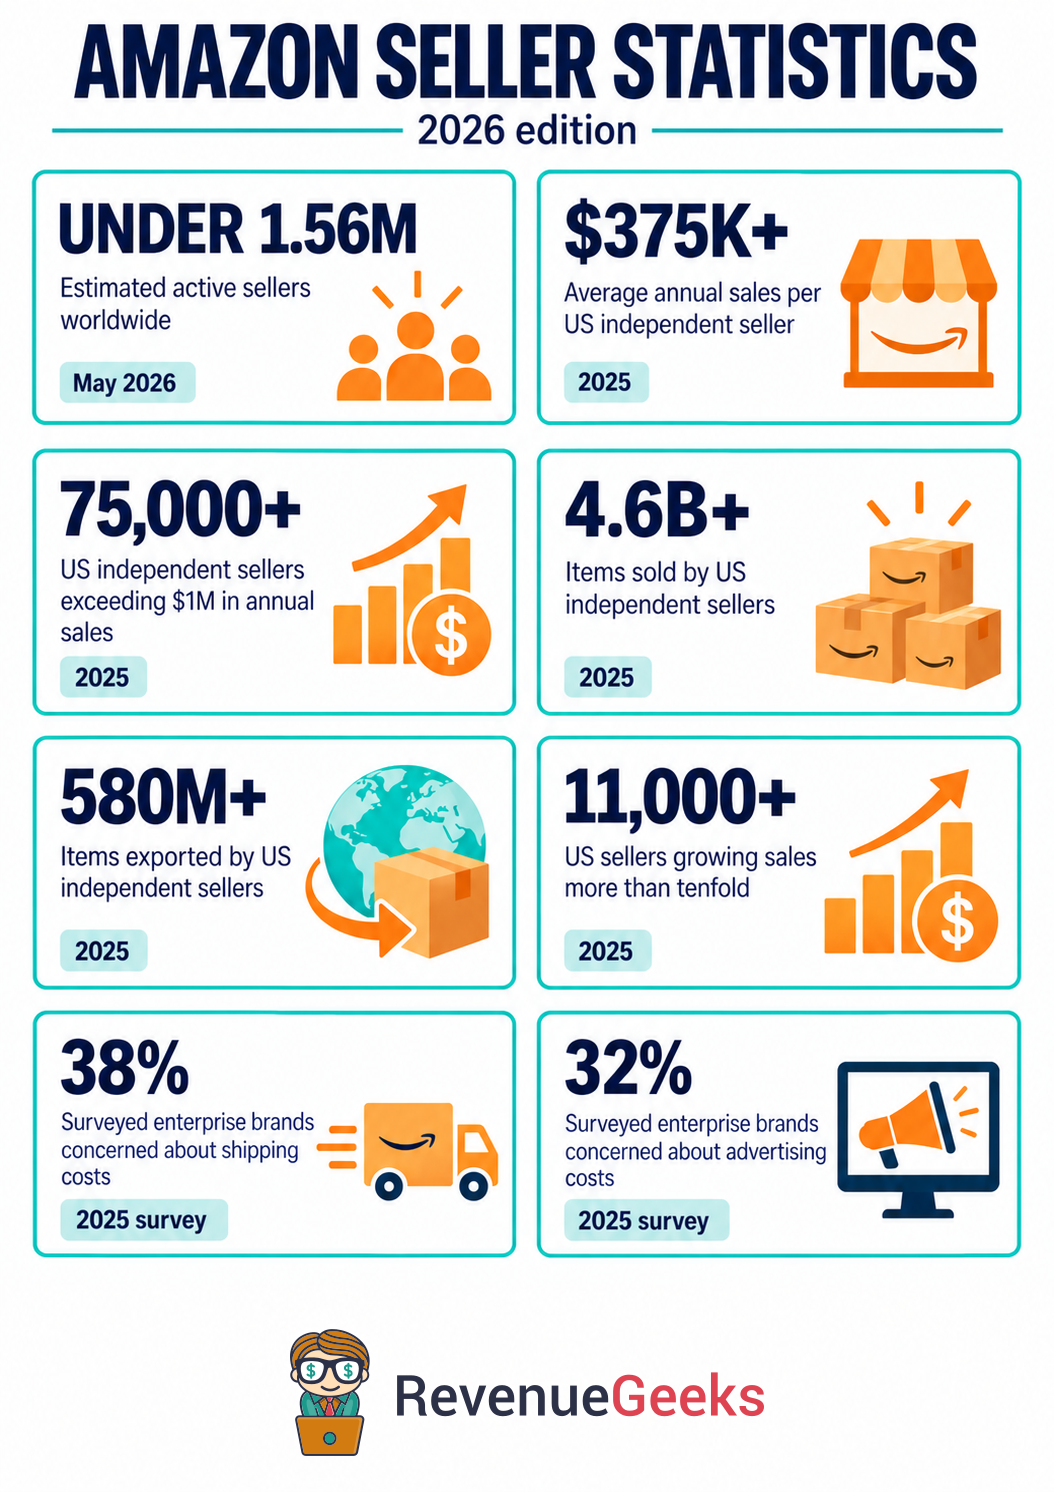
- Fewer than 1.56 million active sellers globally, according to a May 2026 estimate
- US independent sellers averaged more than $375,000 in Amazon sales in 2025
- More than 75,000 independent sellers surpassed $1 million in sales in 2025
- US independent sellers exported more than 580 million items in 2025
- More than 11,000 US sellers grew Amazon sales over tenfold in 2025
- US independent sellers sold more than 8,900 items per minute in 2025
- 38% of surveyed enterprise brands cited higher shipping costs as a challenge in 2025
- 32% of surveyed enterprise brands were concerned about growing advertising expenses in 2025
Need a figure for an article or presentation? Use “Cite this statistic” beside any fact below. Download the statistics (CSV).
Infographic
Download this infographic (PNG). Reuse it with a link to RevenueGeeks.
General Amazon Seller Statistics
US independent sellers averaged more than $375,000 in Amazon sales in 2025
This is average sales revenue. It does not show median seller sales, owner take-home pay, or profit after costs.
More than 75,000 independent sellers surpassed $1 million in sales in 2025
This counts businesses above a revenue threshold; it does not mean each seller earned $1 million in profit.
US independent sellers sold more than 8,900 items per minute in 2025
Amazon also reports more than 4.6 billion items sold over the year. These are rounded thresholds, not exact figures to reconcile by multiplication.
Independent sellers supported more than 2 million US jobs in 2025
These jobs are in seller businesses. They are separate from Amazon employees.
Independent sellers account for more than 60% of Amazon store sales
Amazon reports that independent sellers contribute most store sales. This sales-share measure should not be substituted for the separate quarterly share of paid units sold by third parties.
More than 11,000 US sellers grew Amazon sales over tenfold in 2025
Amazon’s impact report highlights businesses whose sales rose by more than 10 times. The figure counts fast-growing sellers; it is not the average growth rate of the marketplace.
Amazon Seller Demographics and Business Models
33% of seller survey respondents were aged 25 to 34 in 2024
Ages 25 to 34 were the largest group, followed by ages 35 to 44 at 31%. This describes the survey sample, rather than a census of every Amazon seller.
67% of seller survey respondents were male and 30% were female in 2024
The report also records 2% as other or preferring not to say. Rounded percentages need not total exactly 100%. The result describes participating sellers and businesses.
55% of seller survey respondents were based in the United States in 2024
The UK accounted for 7% of respondents, Canada 6% and India 5%. These are respondent locations, not a measure of each country’s share of the entire marketplace.
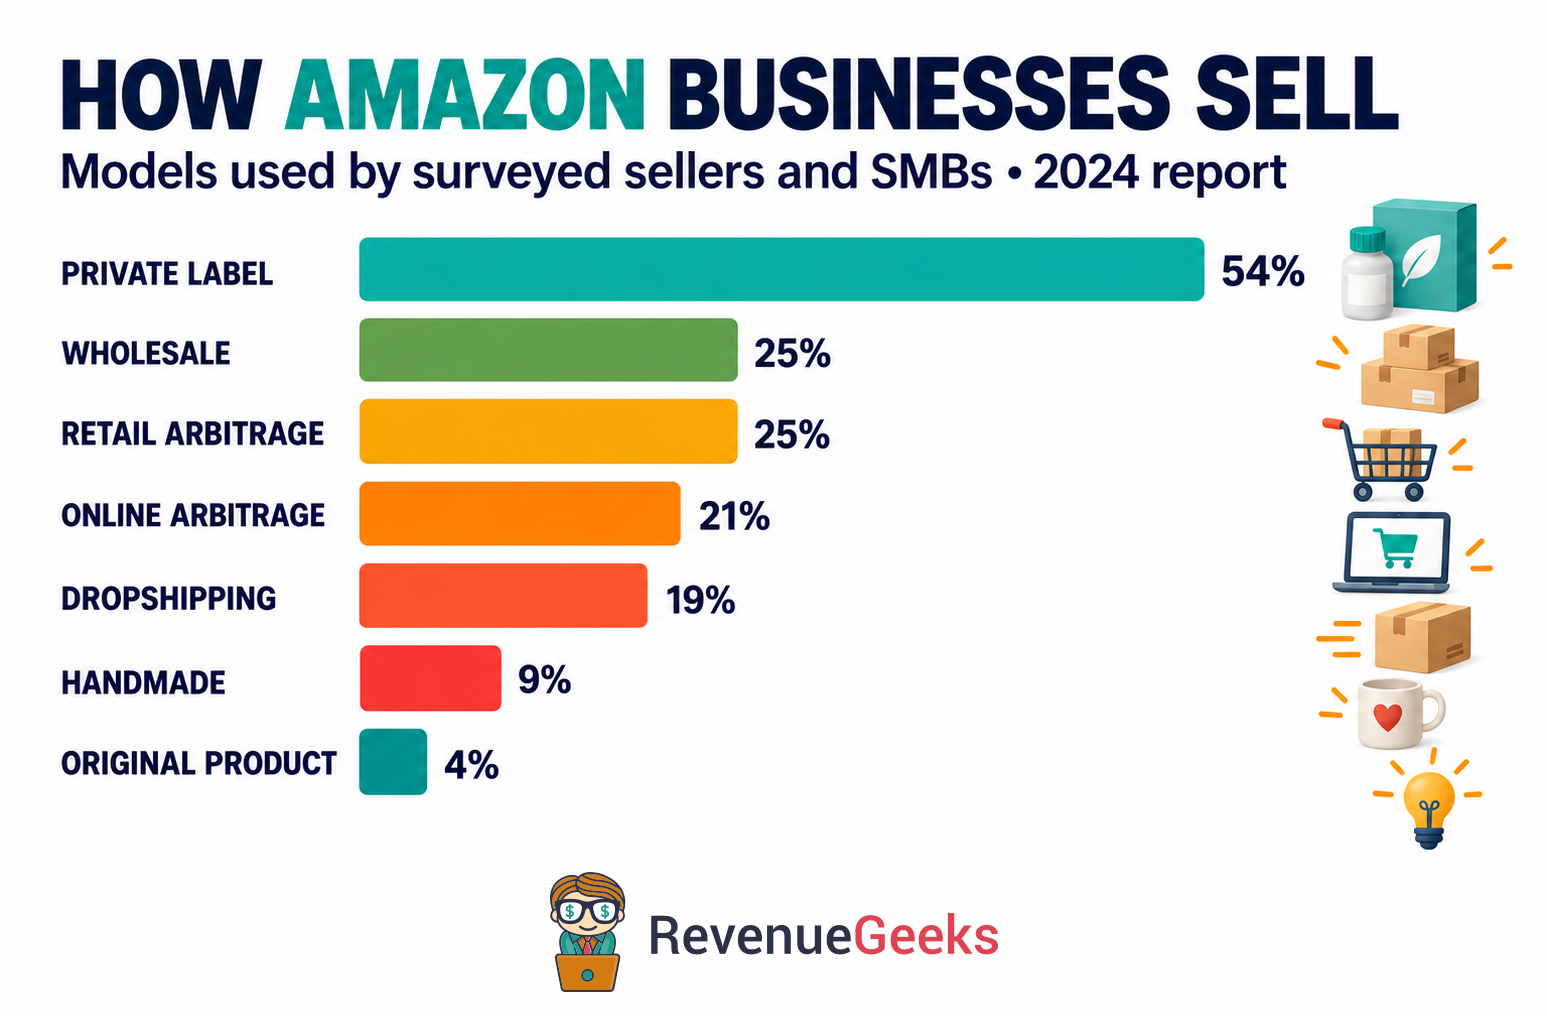
54% of surveyed sellers and SMBs used private label in 2024
Wholesale and retail arbitrage each reached 25%, online arbitrage 21%, dropshipping 19%, handmade 9% and original products 4%. Respondents could use more than one model, so the percentages overlap.
Download this infographic (PNG). Reuse it with a link to RevenueGeeks.
71% of surveyed Amazon businesses sourced products from China in 2024
China led supplier locations in the survey. The United States followed at 30%, while India accounted for 14%. Sourcing from a country does not mean a seller is based there.
How Many Sellers Make a Living on Amazon?
Fewer than 1.56 million active sellers globally, according to a May 2026 estimate
Marketplace Pulse tracks public storefronts. Its activity rule excludes accounts without recent feedback; this is an estimate, not an Amazon census.
57% of surveyed sellers and SMBs reported profit margins above 10% in 2024
The report groups businesses by their reported margin. A margin percentage alone cannot show whether an owner can live on the business: monthly sales, overhead and cash tied up in inventory also matter.
60% of surveyed Amazon businesses also sold through another channel in 2023
The 2024 seller report found that most respondents were active beyond Amazon. That makes Amazon sales only one part of revenue for many businesses.
How Much Do Amazon Sellers Make?
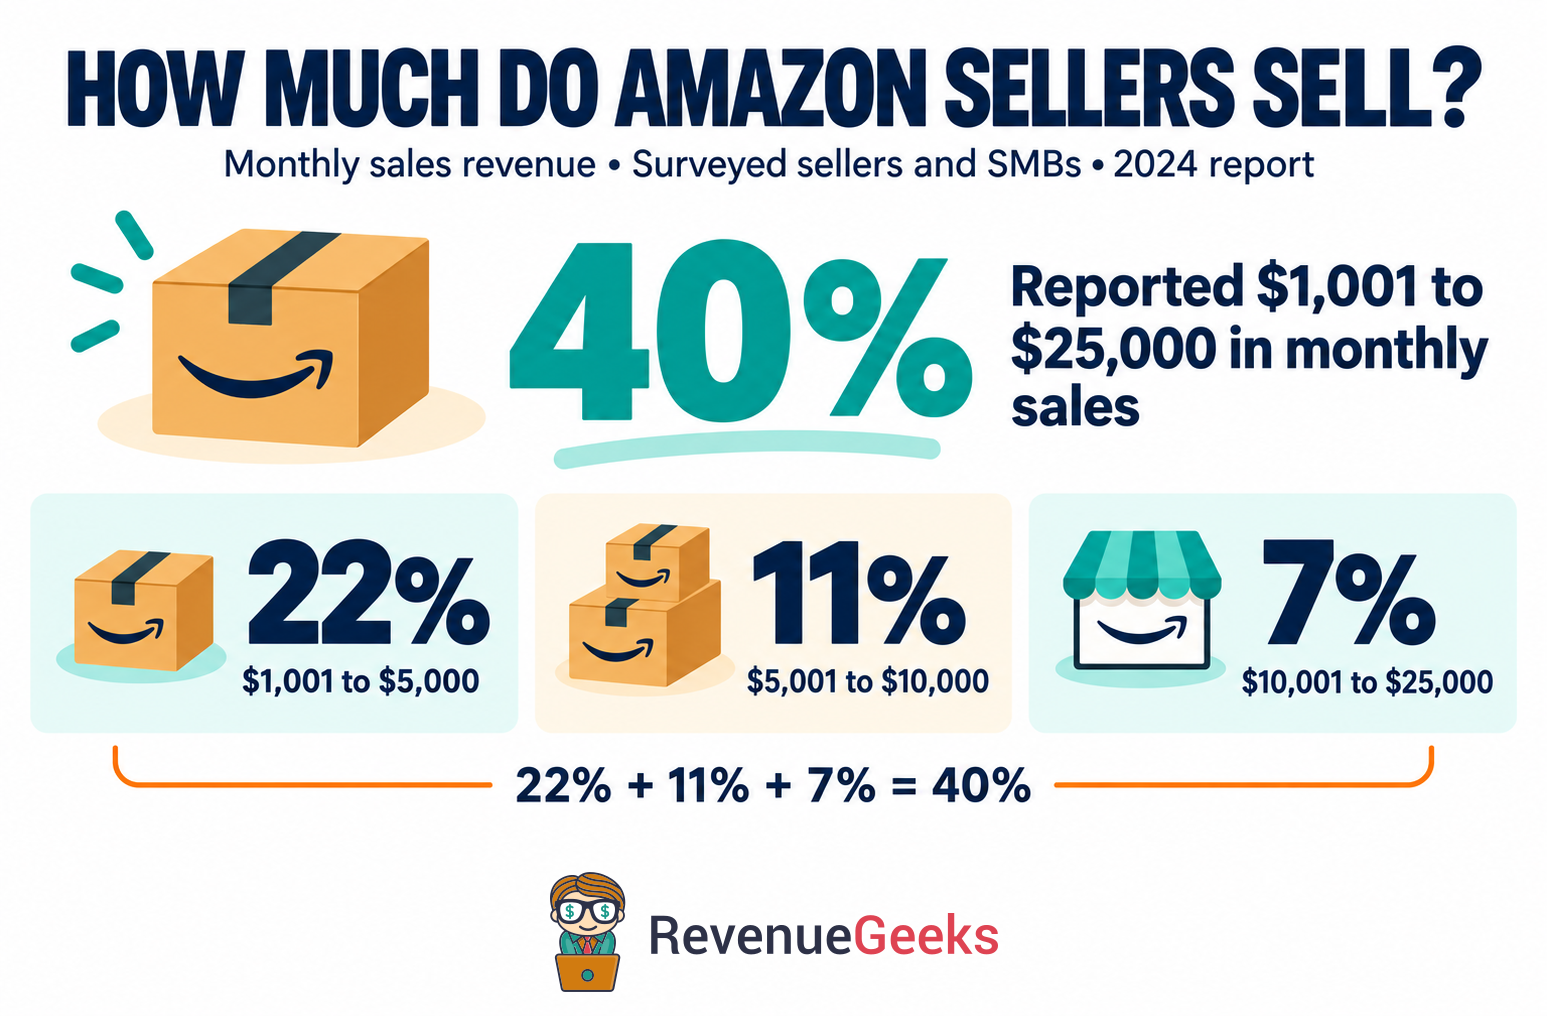
40% of surveyed small sellers reported $1,001 to $25,000 in monthly sales in 2024
The three monthly revenue bands were $1,001 to $5,000 (22%), $5,001 to $10,000 (11%) and $10,001 to $25,000 (7%). Together they make 40%. Sales revenue is different from profit or owner income.
Download this infographic (PNG). Reuse it with a link to RevenueGeeks.
30% of surveyed sellers and SMBs reported more than $5,000 in monthly sales in 2024
This group overlaps the above-$1,000 group. Do not add the threshold percentages.
19% of surveyed sellers and SMBs reported more than $10,000 in monthly sales in 2024
The result is a survey response, not the chance that a new seller will reach this level.
24% of surveyed sellers and SMBs had exceeded $100,000 in lifetime sales in 2024
RevenueGeeks calculated 24% by adding the report’s rounded lifetime-sales bands above $100,000: 10% + 8% + 5% + 1%. Lifetime sales must not be described as annual earnings.
63% of surveyed enterprise brands and retailers exceeded $100,000 in monthly sales in 2024
Jungle Scout separates these larger businesses from sellers and SMBs. Their results should not be used as a benchmark for a typical new seller.
15% of surveyed sellers and SMBs reported margins of 21% to 25% in 2024
This is a share of survey respondents, not a recommended margin for every product. Fees, product costs, returns and advertising can produce very different results between categories.
52% of surveyed sellers and SMBs exceeded $1,000 in monthly sales in 2024
Adding the revenue bands above $1,000 gives 52%. This includes both smaller businesses and high-volume sellers; it does not describe the sales of a typical beginner.
Amazon FBA and FBM Statistics
82% of surveyed Amazon businesses used FBA in the 2024 report
FBA means Fulfillment by Amazon. Respondents could also use FBM, so overall fulfillment-method percentages are not mutually exclusive.
34% of surveyed Amazon businesses used FBM in the 2024 report
FBM means Fulfillment by Merchant. This overall share uses a different denominator from the FBA-only, FBM-only and hybrid breakdown below.
64% of the FBA/FBM subgroup used FBA exclusively in the 2024 report
Within this subgroup, 14% used only FBM and 22% used both. Together the three shares total 100%.
14% of the FBA/FBM subgroup used FBM exclusively in the 2024 report
Adding the 22% hybrid share gives 36% within this subgroup. It does not replace the 34% overall FBM figure.
22% of the FBA/FBM subgroup combined both methods in the 2024 report
Hybrid fulfillment describes using both methods, not a separate measure of sales volume.
What Does It Take to Start Selling on Amazon?
64% of surveyed Amazon businesses started with less than $5,000 in the 2024 report
The reported investment includes startup spending such as products, storage, seller fees and advertising. It is not a minimum budget recommendation for 2026.
25% of surveyed Amazon businesses started with less than $1,000 in the 2024 report
These respondents are part of the under-$5,000 group, so the two percentages overlap.
58% of surveyed Amazon businesses became profitable within a year in the 2024 report
Another 22% reported that they were not yet profitable. The survey focuses on active listings and cannot measure the overall failure rate of everyone who tried selling.
81% of surveyed sellers and SMBs used at least some of their own cash in 2024
Businesses could use multiple funding sources. This does not mean 81% were financed entirely from savings.
74% of surveyed sellers and brands launched within six months in the 2024 report
The timeline runs from the first effort to a live product listing. It measures launch speed, not time to recover the startup investment or reach a steady profit.
Which Product Categories Dominate Amazon Seller Listings?
35% of surveyed Amazon businesses sold in Home & Kitchen in 2024
Home & Kitchen led category participation. This measures sellers selecting a category, not the category’s share of Amazon revenue.
61% of surveyed Amazon businesses priced products between $16 and $50 in 2024
This is the report’s published summary of average product pricing. The individual chart bands are rounded, so adding the displayed percentages can differ slightly from that summary.
More than 75% of surveyed sellers and SMBs sold fewer than 10 products in 2024
The count describes the size of product ranges in the survey. A smaller range can still contain high-volume products, so product count should not be treated as a revenue ranking.
Amazon Seller Advertising Statistics
84% of surveyed Amazon businesses advertised on or off Amazon in 2024
The headline includes businesses of different sizes. Among the sellers and SMBs subgroup, 58% used ecommerce PPC, 42% used social media and 34% used paid search. Businesses could use several channels.
68% of surveyed sellers and SMBs spent up to $2,500 a month on advertising in 2024
The spending band includes businesses that spent nothing. Advertising costs covered the businesses’ promotional activity and should not be read as an Amazon-only CPC benchmark.
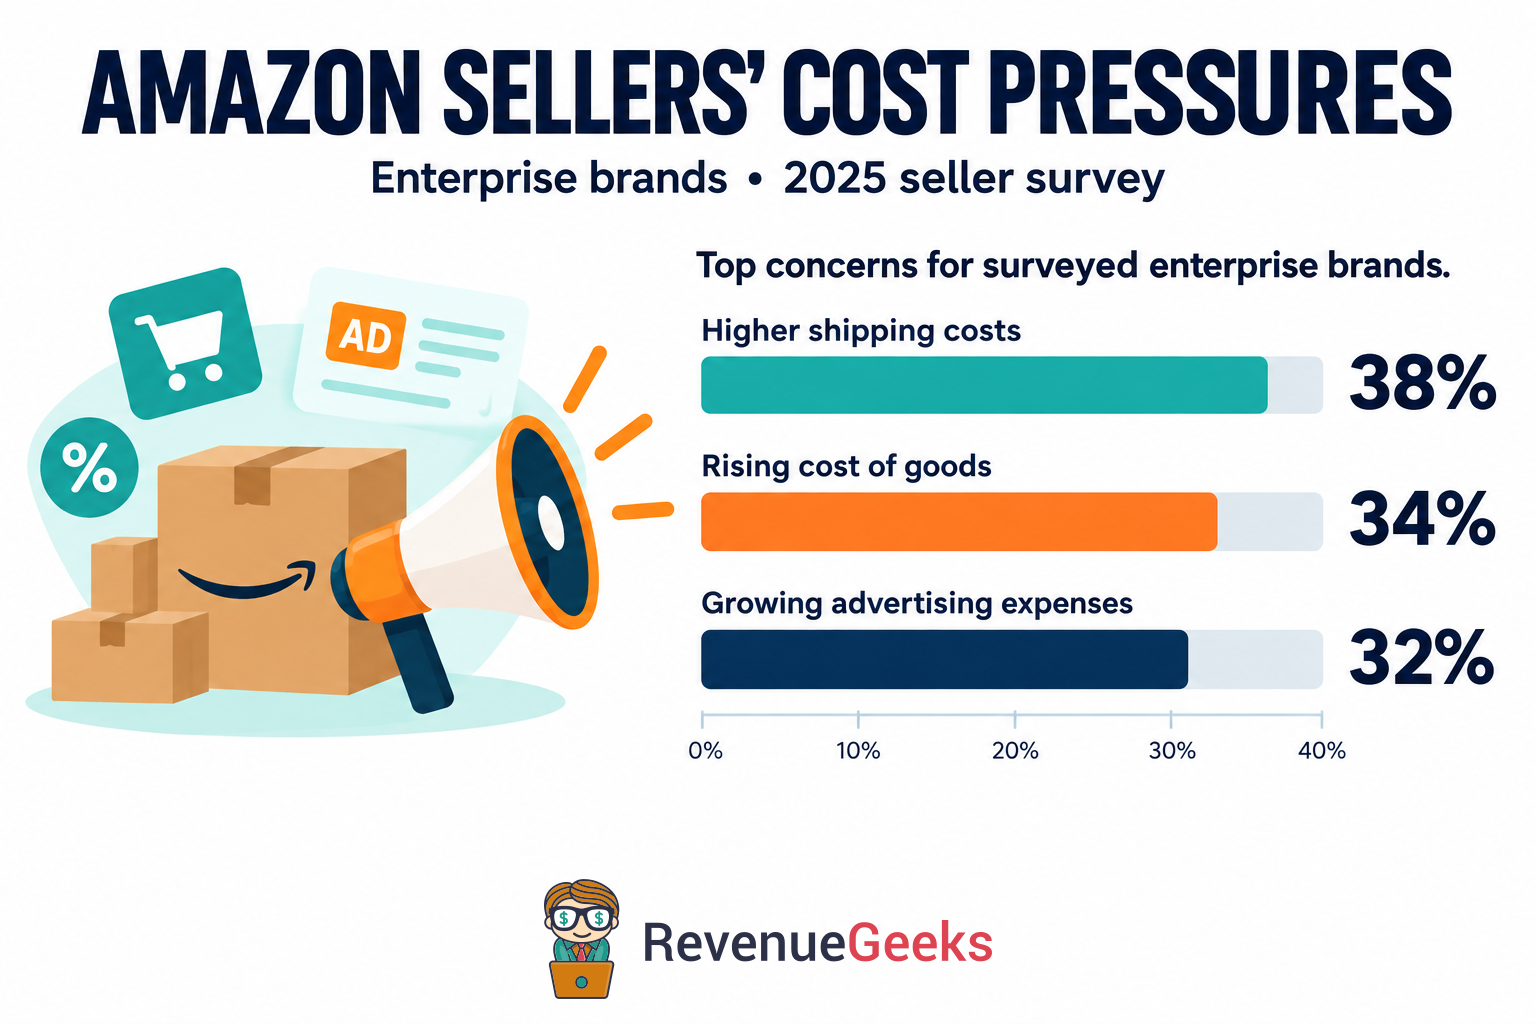
38% of surveyed enterprise brands cited higher shipping costs as a challenge in 2025
Shipping was the most frequently cited cost pressure in this published comparison of enterprise brands. For a seller, shipping changes affect the amount left after product costs, marketplace fees and advertising.
34% of surveyed enterprise brands were concerned about the rising cost of goods in 2025
The cost of goods was another major concern in the 2025 seller survey. This figure describes enterprise brands, so it should not be treated as the share of every independent Amazon seller.
32% of surveyed enterprise brands were concerned about growing advertising expenses in 2025
Nearly one-third of surveyed enterprise brands identified advertising costs as a concern. This measures a business challenge, which is different from the share of businesses that advertise or the amount they spend.
Download this infographic (PNG). Reuse it with a link to RevenueGeeks.
How Do Global Sales Events Impact Seller Revenues?
Independent sellers sold more than 200 million items during Prime Day 2024
Amazon reported this total for independent sellers during the July 16 to 17 event. It is an item count, which is distinct from sales revenue and from the number of orders.
US online retail spending reached $26.4 billion during the June 2026 Prime Day period
The four-day observation window was June 23–26. Adobe measured the wider US online retail market, so $26.4 billion must not be called Amazon’s own sales.
Independent sellers set new sales and unit records during Prime Day 2025
Amazon’s recap says independent sellers exceeded the previous event in both sales and products sold. The event lasted four days, compared with two days in 2024.
Amazon Seller Fun Facts
US independent sellers exported more than 580 million items in 2025
Amazon’s US impact report measures products shipped abroad by independent sellers. Exported items form part of seller activity rather than an extra amount to add to Amazon’s company revenue.
Amazon helped connect small businesses with over $1 billion in financing in 2025
The report covers financing arranged through Amazon’s lending partners. Financing provides business capital and is separate from sales, earnings or grants.
More than 33,000 brands have used Amazon IP Accelerator
The 2025 impact report says the program has supported brands across 35 countries and 18 languages. This is a cumulative program figure, not the number of brands enrolled in one year.
Ready to put the numbers into practice? Read how to sell on Amazon and compare the best Amazon seller tools.
Use These Amazon Seller Statistics
You can reuse our charts and quote this compilation in your reporting. Credit RevenueGeeks and link to the relevant statistic or this page so readers can find the full context. Keep the stated year and population with the number.
For more detail, explore Amazon statistics, our Amazon FBA fee history and the Amazon PPC bid calculator.
References:
Compiled by RevenueGeeks from Amazon’s 2025 Small Business Empowerment Report; Jungle Scout’s State of the Amazon Seller 2024 and 2025; Marketplace Pulse’s May 2026 active-seller estimate; Amazon’s Prime Day event recaps; and Adobe Digital Insights’ 2026 Prime Day report.
The 2025 seller survey ran from January 10 to 27, 2025. The detailed 2024 breakdowns came from a survey conducted from December 1, 2023 to January 3, 2024. Each figure identifies its respondent group and year. Dollar figures are USD. Last reviewed September 8, 2026.