


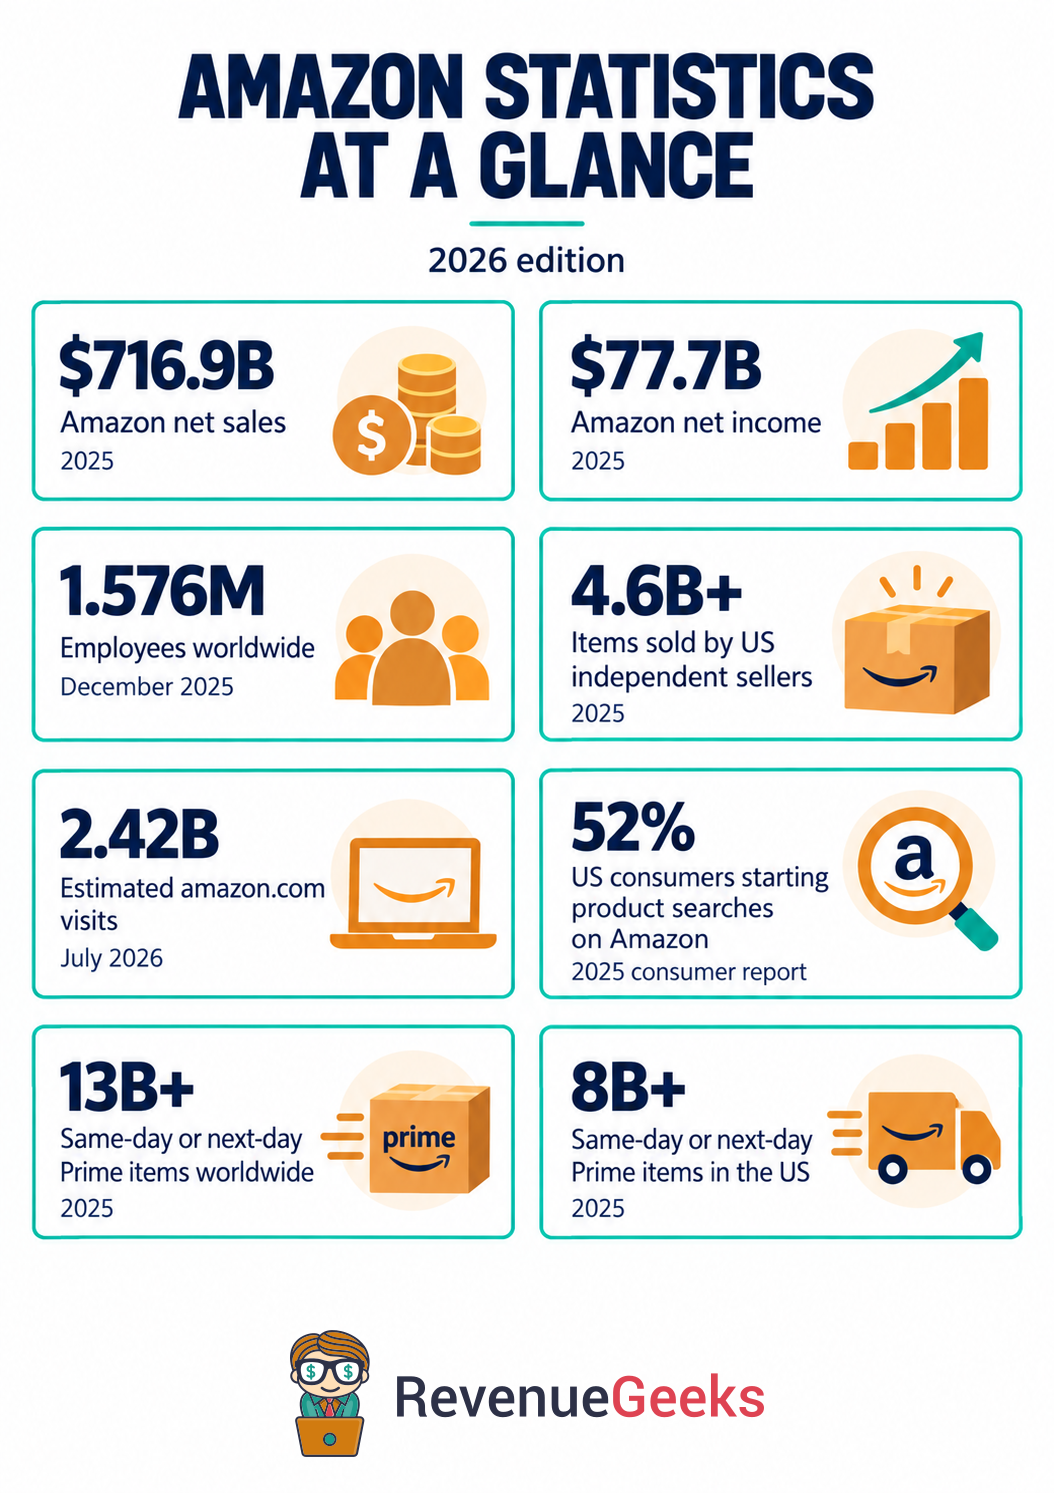
Amazon generated $716.9 billion in net sales in 2025, while amazon.com attracted an estimated 2.42 billion visits in July 2026. These Amazon statistics cover company finances, seller activity and shopping habits, including the latest published Prime delivery results.
Top Amazon Statistics (Editor's Pick)
- Amazon generated $716.9 billion in net sales in 2025
- Amazon’s net income reached $77.7 billion in 2025
- Amazon employed 1,576,000 full-time and part-time people at the end of 2025
- US independent sellers sold more than 4.6 billion items in Amazon’s store in 2025
- Amazon.com received an estimated 2.42 billion visits in July 2026
- 52% of surveyed US consumers started product searches on Amazon in the 2025 report
- Amazon delivered over 13 billion Prime items the same or next day worldwide in 2025
- US Prime members received over 8 billion items the same or next day in 2025
Need a figure for an article or presentation? Use “Cite this statistic” beside any fact below. Download the statistics (CSV).
Infographic
Download this infographic (PNG). Reuse it with a link to RevenueGeeks.
Amazon General Statistics
Amazon employed 1,576,000 full-time and part-time people at the end of 2025
The company excludes contractors and temporary personnel from this count.
How Much Does Amazon Make?
Amazon generated $716.9 billion in net sales in 2025
This includes retail, AWS and other businesses. It is not the gross value of every third-party item sold on the marketplace.
Amazon’s reported net sales grew 12% in 2025
The comparable 2024 net sales figure was $638.0 billion. Amazon reports growth rounded to a whole percentage.
Amazon’s net income reached $77.7 billion in 2025
Net income was $59.2 billion in 2024. Net income and operating income are different accounting measures.
Amazon reported $80.0 billion in operating income in 2025
This is the consolidated operating result across North America, International and AWS.
North America segment sales reached $426.3 billion in 2025
North America is a reporting segment; it is not interchangeable with US-only marketplace sales.
International segment sales reached $161.9 billion in 2025
Amazon’s International segment is reported separately from AWS.
AWS generated $128.7 billion in sales in 2025
AWS segment sales increased 20% year over year.
AWS contributed $45.6 billion in operating income in 2025
Dividing $45.6 billion by Amazon’s $80.0 billion total gives about 57% of consolidated operating income, using rounded reported figures.
Amazon advertising services generated approximately $68.6 billion in 2025
RevenueGeeks summed the four reported quarters: $13.921bn + $15.694bn + $17.703bn + $21.317bn.
How Popular Is Amazon?
Amazon.com received an estimated 2.42 billion visits in July 2026
The estimate covers visits to amazon.com across devices. One person can make several visits, and the figure excludes separate country domains such as amazon.co.uk.
Download this infographic (PNG). Reuse it with a link to RevenueGeeks.
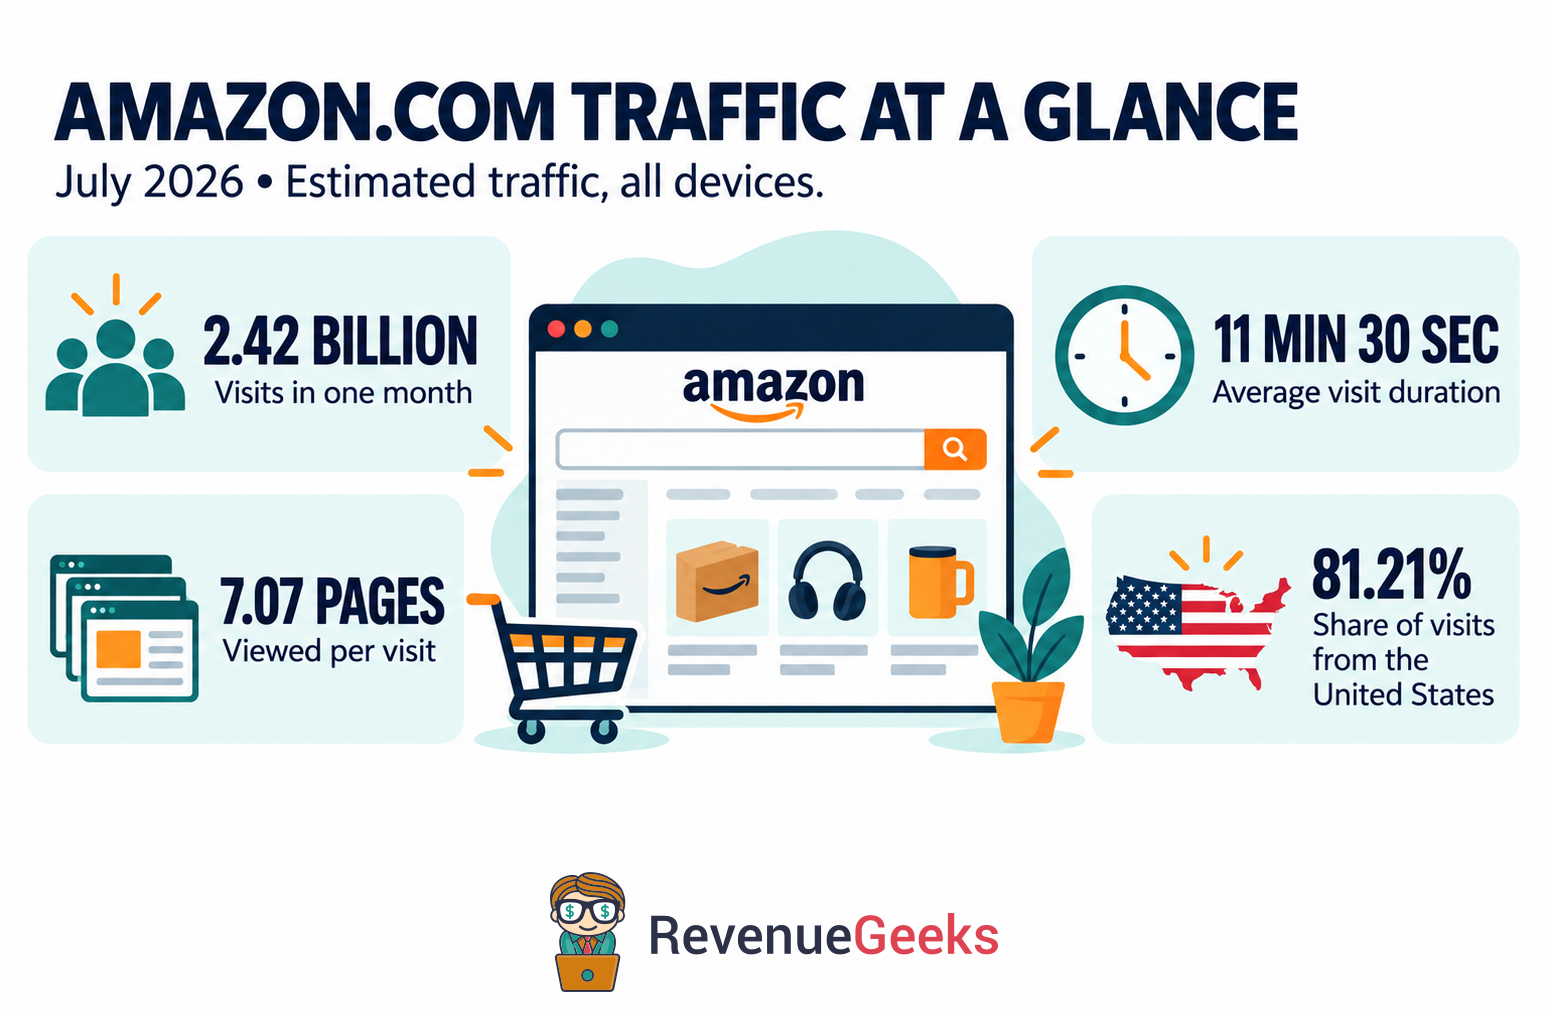
The United States supplied an estimated 81.21% of amazon.com visits in July 2026
The country share covers all devices in the traffic estimate. It is not a desktop-only figure or the proportion of Amazon customers who live in the US.
An amazon.com visit lasted an estimated 11 minutes 30 seconds in July 2026
Average visit duration describes time on the website. It is different from the time needed to complete an individual purchase and does not measure shopping-app sessions.
Amazon.com visitors viewed an estimated 7.07 pages per visit in July 2026
Pages per visit measures website browsing depth. The estimate counts page views rather than products bought, unique visitors or customer accounts.
Amazon.com traffic rose an estimated 3.71% month over month in July 2026
Semrush estimates approximately 2.33 billion visits in June and 2.42 billion in July. The reported growth rate uses underlying estimates before those totals are rounded.
52% of surveyed US consumers started product searches on Amazon in the 2025 report
Amazon was the most common starting point for product searches in this US survey. Respondents could select more than one service. The 2025 report reflects a survey conducted in December 2024.
Amazon Shopping Habits
63% of surveyed US consumers ranked price and discounts as their top Amazon purchase factor in the 2025 report
Price and discounts led purchase decisions in Jungle Scout’s 2025 consumer report. About one-third of respondents also prioritized reviews, shipping or brand reputation. The survey took place in December 2024.
64% of surveyed US consumers were influenced by Amazon ratings and reviews in Q1 2024
Nearly two-thirds agreed that the products with the best ratings or reviews influenced their choices. This measures stated preferences rather than observed conversions.
60% of surveyed US consumers valued Amazon reviews with photos or videos in Q1 2024
Visual review content influenced the purchase choices of three in five respondents. This is distinct from product photos supplied by a seller.
58% of surveyed US consumers looked for Prime shipping in Q1 2024
Respondents agreed that Prime shipping influenced the products they considered. The figure measures a shopping preference, rather than Prime membership ownership.
57% of surveyed US consumers looked for the fastest shipping on Amazon in Q1 2024
Shipping speed was a commonly reported buying factor. This is separate from whether a product carried a Prime shipping label.
68% of surveyed US consumers shopped on Amazon more than once a month in Q1 2024
This is the broad frequency threshold reported in the survey. Daily and weekly shoppers sit within that group and should not be added to it.
35% of surveyed US consumers shopped on Amazon at least weekly in Q1 2024
The weekly threshold describes a subset of frequent shoppers. It is not an additional group to add to those shopping more than once per month.
41% of surveyed US consumers liked Amazon’s automatic shipping feature in Q1 2024
The survey asked whether respondents liked using the subscription or automatic shipping feature. Agreement does not establish that all of them had an active subscription.
27% of surveyed US consumers used deal-finding browser tools in Q1 2024
These respondents agreed that they used browser extensions or plug-ins to find Amazon deals. The result measures a reported behavior in the US sample.
How Many Products Does Amazon Sell?
US independent sellers sold more than 4.6 billion items in Amazon’s store in 2025
For seller income and fulfillment survey benchmarks, see the linked Amazon seller statistics reference below.
Download this infographic (PNG). Reuse it with a link to RevenueGeeks.
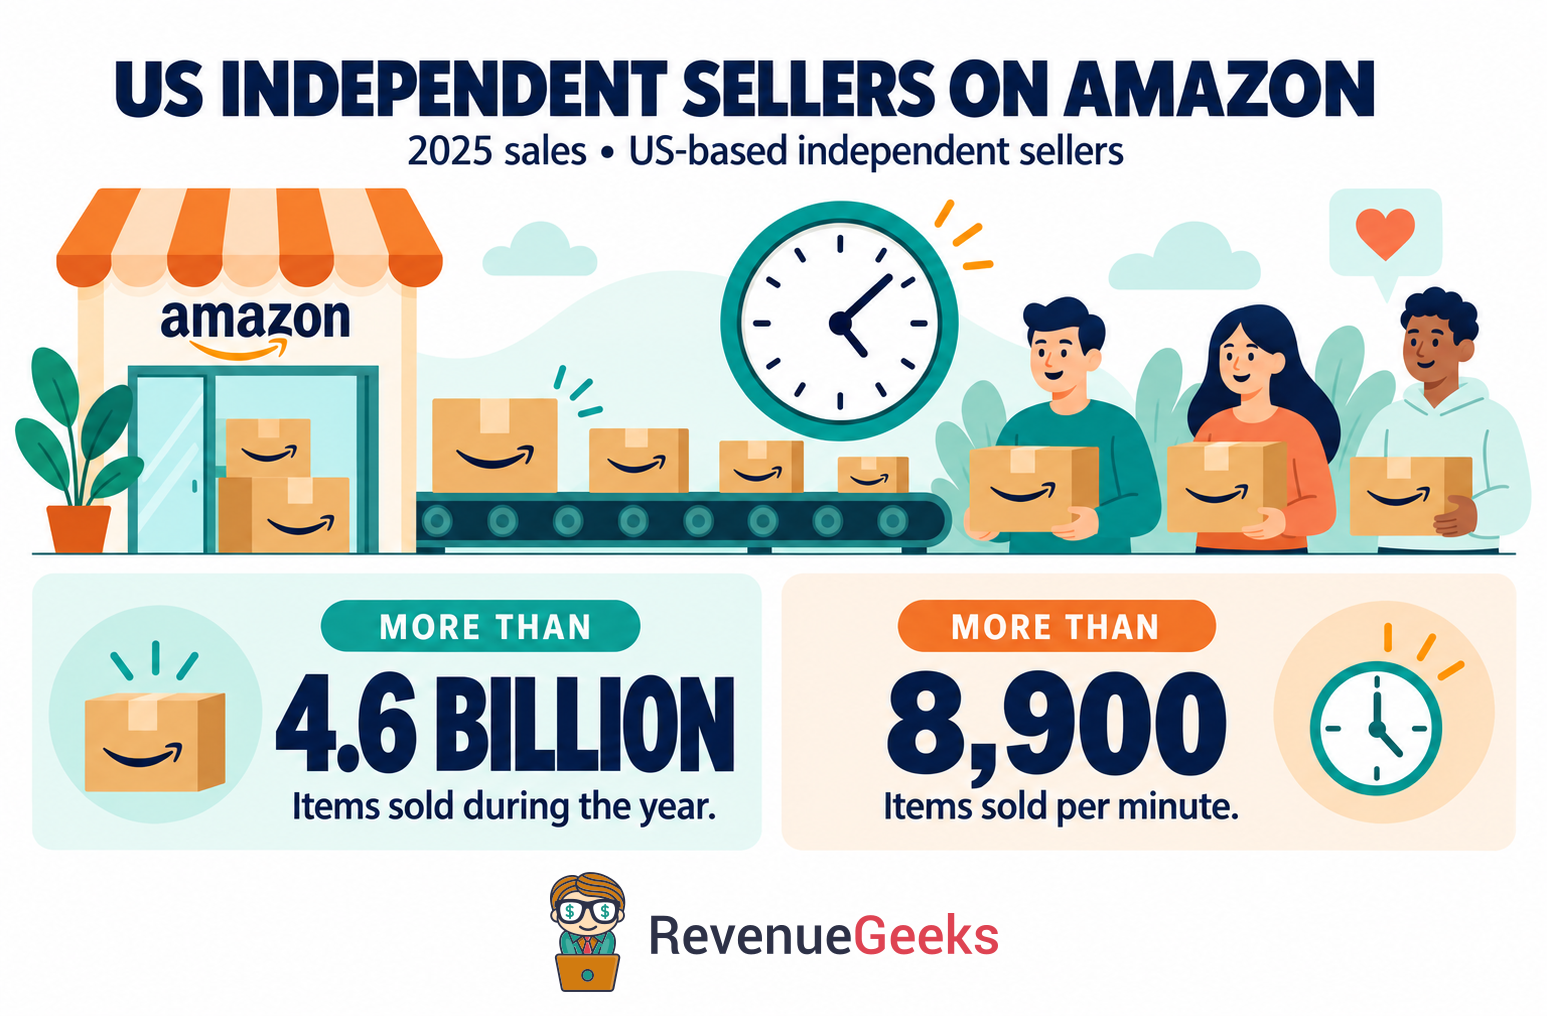
Independent sellers account for more than 60% of Amazon store sales, Amazon reports
This is Amazon’s wording in its impact report. Do not relabel this number as a precisely measured share of units in a particular quarter.
US independent sellers exported more than 580 million items in 2025
Exports are a subset of seller activity; do not add them to total items as if they were separate sales.
Amazon Prime Membership and Delivery Statistics
61% of surveyed US consumers had an Amazon Prime account in Q1 2024
This is account ownership among 1,000 survey participants in the United States. It is not a global membership count, nor an estimate of the number of unique paying subscribers.
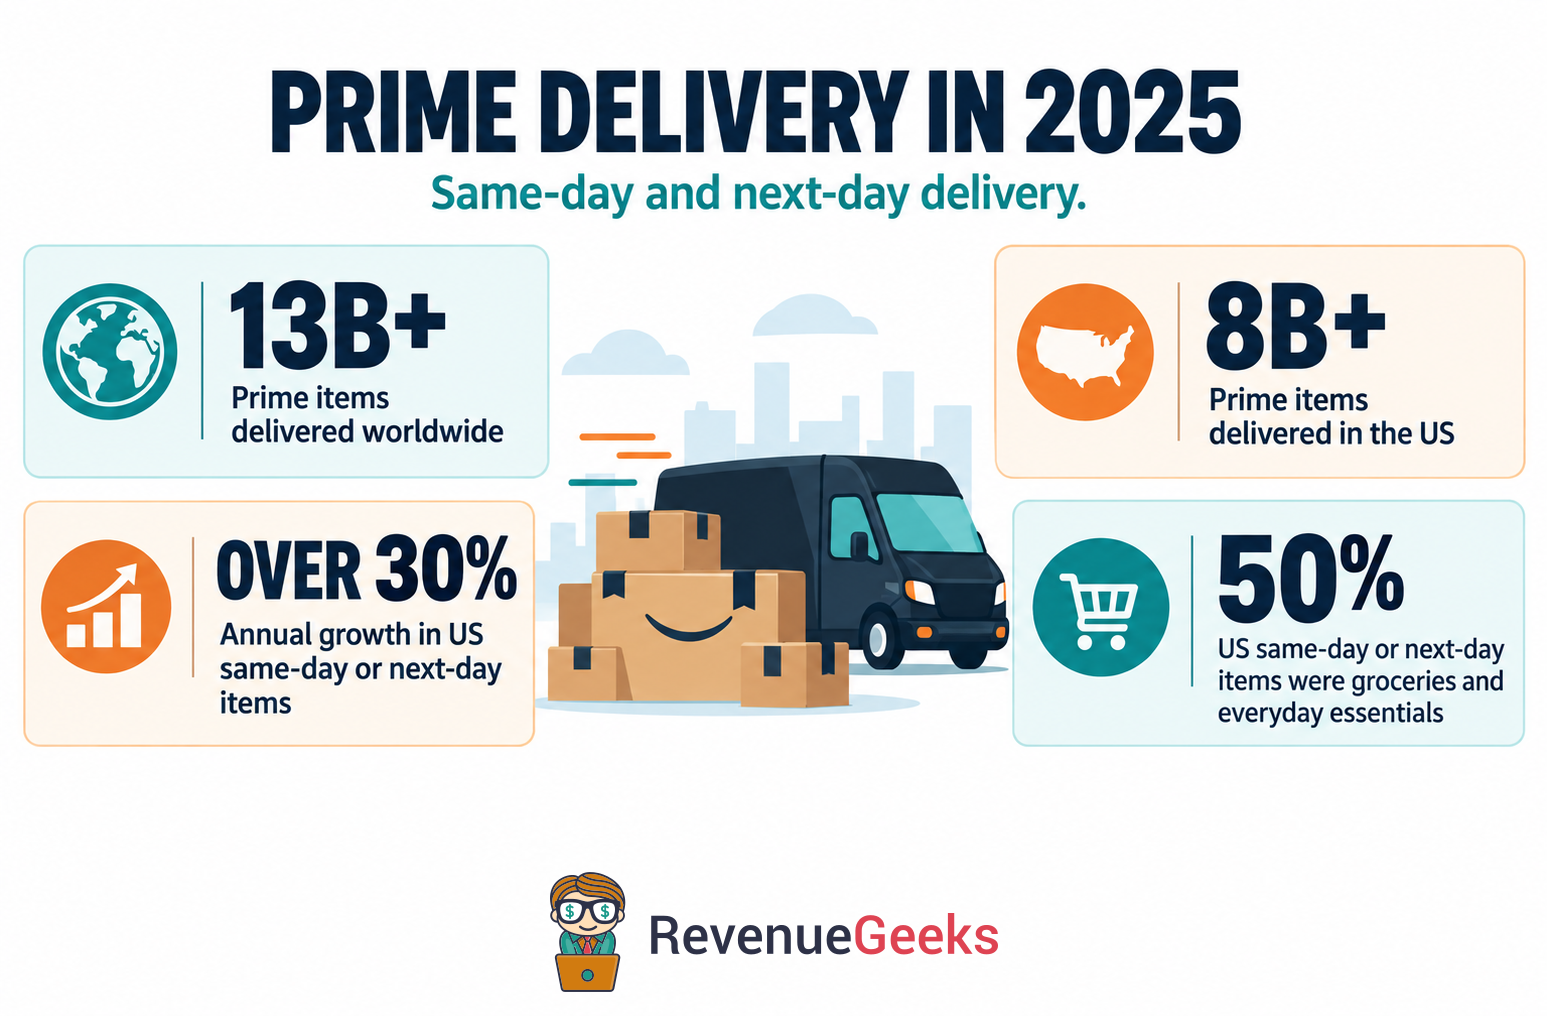
Amazon delivered over 13 billion Prime items the same or next day worldwide in 2025
Amazon’s 2025 delivery report counts items that reached Prime members on the day of purchase or the following day. The worldwide total includes more than 8 billion items delivered in the United States.
US Prime members received over 8 billion items the same or next day in 2025
The US total forms part of Amazon’s global figure. Amazon also reported that half of these deliveries were groceries or everyday essentials, showing how often members use rapid delivery for routine purchases.
US same-day or next-day Prime item deliveries grew more than 30% in 2025
Amazon reported growth of more than 30% compared with 2024. This measures items delivered the same or next day to US Prime members. It does not measure growth in membership or Amazon’s total revenue.
Groceries and everyday essentials made up half of US same-day or next-day Prime items in 2025
Amazon reported that groceries and everyday essentials accounted for 50% of these US deliveries. The share covers same-day and next-day Prime items, rather than every item sold through Amazon.
Download this infographic (PNG). Reuse it with a link to RevenueGeeks.
Amazon Prime Day Statistics
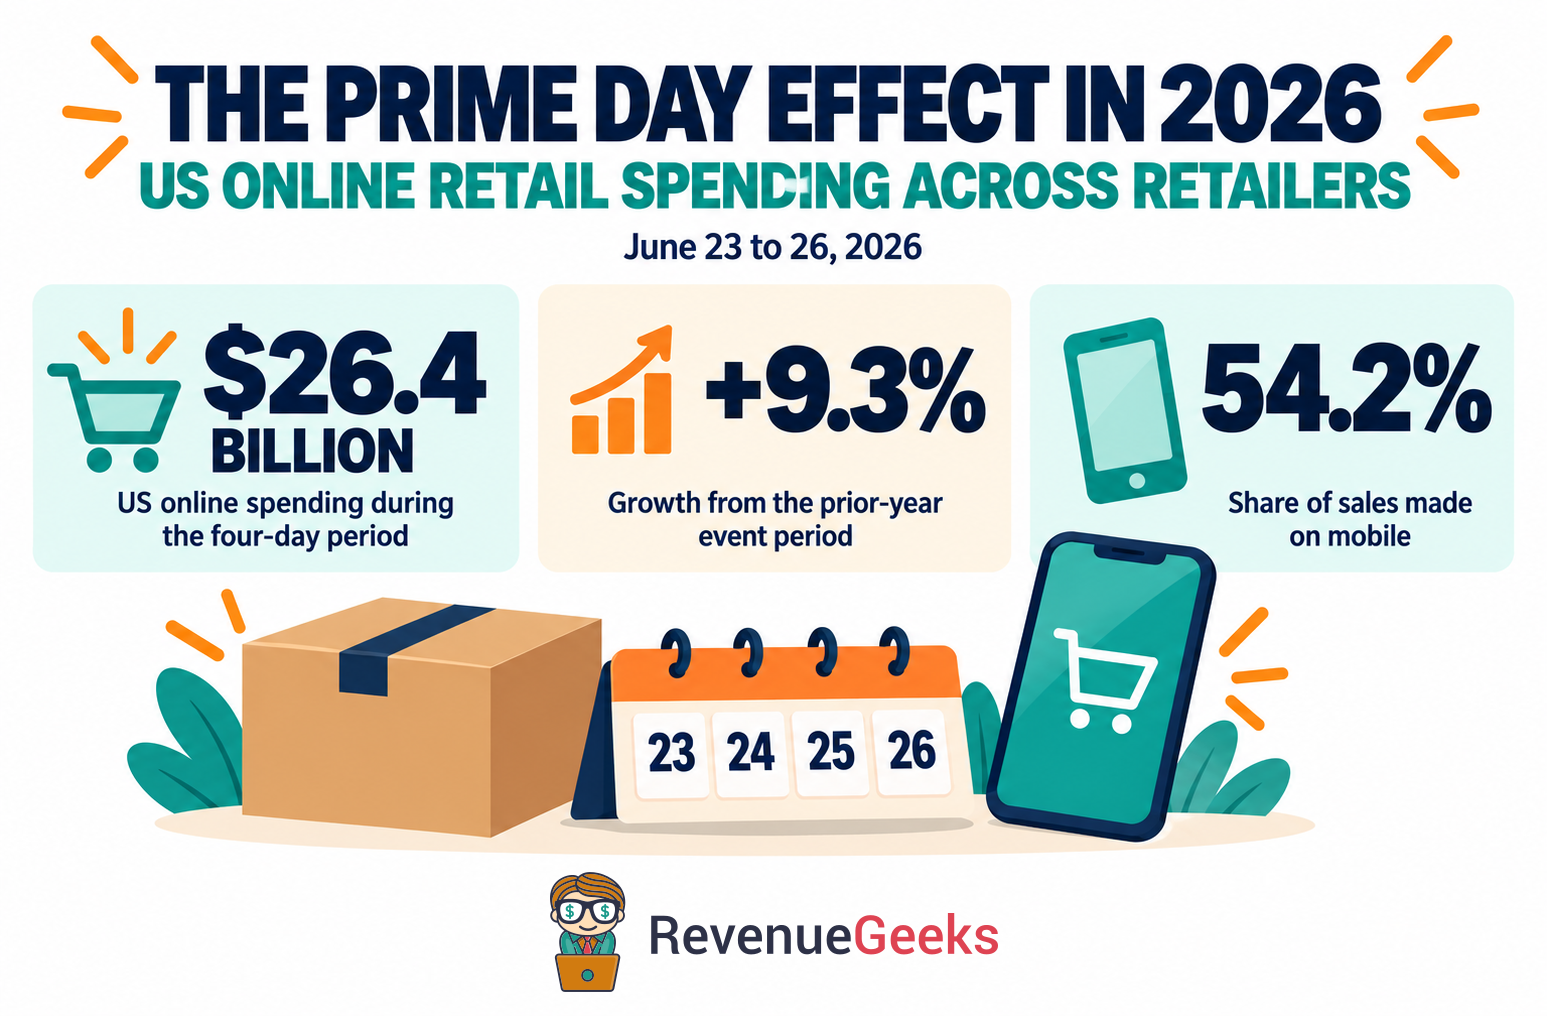
US online retail spending reached $26.4 billion during the June 2026 Prime Day period
The four-day observation window was June 23–26. Adobe measured the wider US online retail market, so $26.4 billion must not be called Amazon’s own sales.
US online retail spending rose 9.3% during the 2026 Prime Day period
The change compares Adobe’s 2026 event period with the prior-year event period.
Mobile accounted for 54.2% of US online sales during the 2026 Prime Day period
Adobe reports $14.2 billion in mobile spending during the event. This is a cross-retailer measure.
Download this infographic (PNG). Reuse it with a link to RevenueGeeks.
Prime Day expanded to four days for the first time in 2025
The July 8 to 11 event doubled the shopping window compared with the two-day event in 2024. Comparisons of event totals should account for that longer duration.
Independent sellers sold more than 200 million items during Prime Day 2024
Amazon’s event recap reports more than 200 million items from independent sellers. This count is separate from Amazon’s own retail products and from retail-wide spending estimates.
Prime members bought more than 375 million items during Prime Day 2023
The total covers the two-day global event on July 11 and 12, 2023. It counts individual items purchased across the Amazon store, rather than orders or unique shoppers.
Fun Amazon Facts
AmazonSmile ended on February 20, 2023
The charitable-shopping program is a historical Amazon service. It is no longer an available way to donate through purchases.
Prime Day began in 2015 with a 24-hour event in nine countries
Amazon launched the first Prime Day on July 15, 2015, to mark its 20th birthday. The event later expanded in both duration and geographic reach.
Fire TV Stick HD was among Amazon’s best-selling Prime Day products in 2025
Fire TV Stick HD and Ring Battery Doorbell were among the event’s best-selling Alexa-enabled devices. Amazon also highlighted products such as Apple AirPods Pro 2 and Dawn Platinum Powerwash among popular purchases.
Amazon plans to reach nearly 500 US cities and towns with Prime Air by the end of 2026
Amazon’s expansion announcement describes a future coverage target. Eligible orders can arrive in as fast as 30 minutes, with most arriving around 60 minutes after checkout. Availability depends on the delivery address and item.
For another view of Amazon’s delivery network, read how Amazon’s DSP program works.
Historical Amazon Benchmarks
Amazon disclosed more than 200 million paid Prime members worldwide in April 2021
This is a dated company disclosure. It is not a verified 2026 membership total, and memberships, household users and website visits are different measures.
Amazon shoppers completed 28% of purchases in three minutes or less, Amazon reported in 2021
Amazon disclosed this shopping-speed figure in its 2020 shareholder letter, published in April 2021. The figure is historical and describes purchases rather than all website visits.
Half of Amazon purchases took less than 15 minutes, Amazon reported in 2021
The same shareholder letter says 50% of purchases were completed in under 15 minutes. The faster 28% group sits within this total; the two percentages must not be added together.
Use These Amazon Statistics
You can reuse our charts and quote this compilation in your reporting. Credit RevenueGeeks and link to the relevant statistic or this page so readers can find the full context. Keep the stated year and population with the number.
For more detail, explore Amazon seller statistics, our Amazon FBA fee history and the Amazon PPC bid calculator.
References:
Compiled by RevenueGeeks from Amazon’s full-year 2025 results, Small Business Empowerment Report and Prime delivery report; Semrush’s July 2026 amazon.com traffic estimates; Jungle Scout’s Annual Consumer Trends Report 2025 and Consumer Trends Report Q1 2024; Amazon’s 2020 shareholder letter, Prime Day recaps and Prime Air announcement; Adobe Digital Insights’ 2026 Prime Day report; and Amazon’s AmazonSmile closure announcement.
The 2025 consumer report surveyed nearly 1,000 US consumers from December 6 to 27, 2024. The Q1 2024 report surveyed 1,000 US adults from February 21 to 23, 2024. Survey responses describe their samples. Website traffic is estimated visits, and retail-wide Prime Day spending is separate from Amazon revenue. Older disclosures appear under Historical Amazon Benchmarks. Dollar figures are USD. Last reviewed September 8, 2026.